
The Finite element Method is a numerical method that is suited to the simulations of 2D or 3D objects. The method has a mesh that defines the physical shape of the object or objects and is made of graphics primitives such as triangles and tetrahedrons. It also has a numerical kernel that acts iteratively on the mesh, finding approximate solutions to partial differential equations so that physical properties such as stress or displacement can be calculated.
It is a technique that can be applied to many time dependent engineering problems.
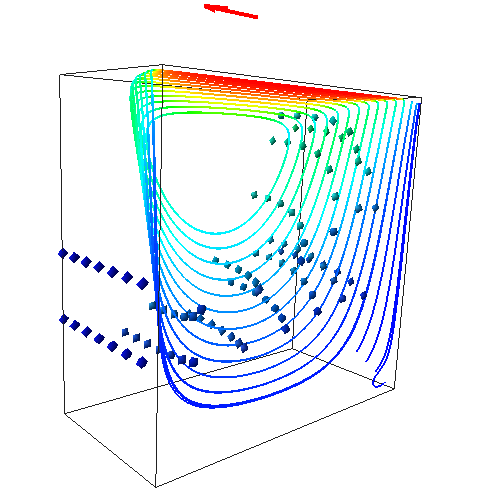
The lid driven cavity is a numerical test case; a cubic cavity filled with fluid has a moving 'lid' which makes the fluid in the cavity move with circular flow pattern. In this case a full Navier Stokes parallel version of an FEA solution needs to be tested. The visualization reveals what the fluid flow is and whether this matches the expected.
The red arrow at the top show the direction that the 'lid' moves to drive the flow of the liquid. Streamlines and particle advection are the visualization techniques to show that the fluid is moving in a circular pattern. The colour of the streamlines gives the speed of the flow and this is, as expected, slowest near the walls of the cavity. There is a twist in the streamline in th bottom right corner which indicates a small eddy and is a sign of a numerically precise solution.
When a hole is excavated into the ground there will be some subsidence in the walls. This will be greater the deeper the hole.
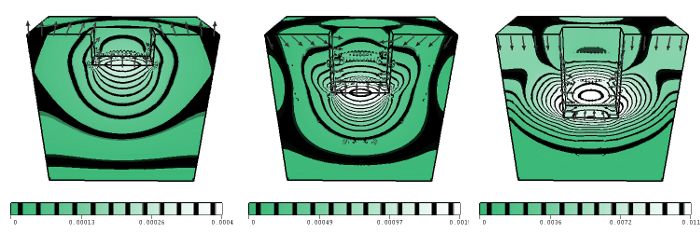
Shows the pressure in the soil and the effects that this pressure is having on the walls of the excavated hole. The hole is shown in cross-section and it can be seen that the soil is being 'pushed' back into the hole. Three time steps are shown; the one on the left has the shallowest hole while the one on the right has the deepest. The colour has been selected as it reproduces well in grayscale, necessary for publication."
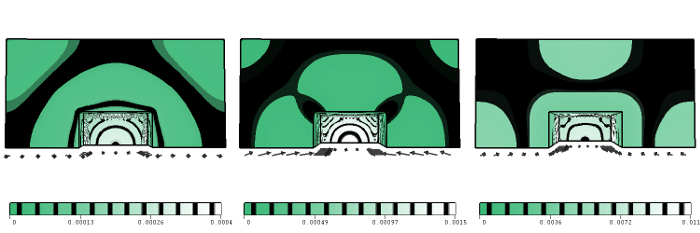
Shows the same time steps given in the previous image but this time the view is from the top.
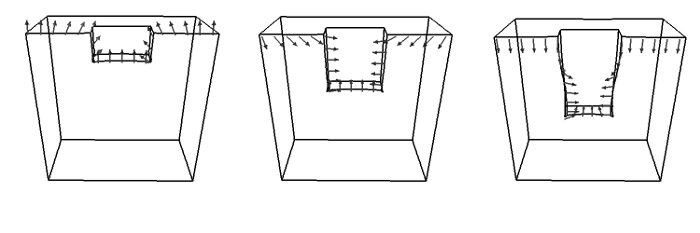
Shows the same time steps given in the previous image but with just the arrows that show how the walls of the hole will subside.
Previous simulations of the nuclear pressure vessel were all of 2D cross-sections of the vessel. This work produced the first full 3D simulation of the vessel.
The visualization work for this project was submitted as Visualization Showcase Competition 2006 and came 4th. The materials from that competition are included here as they give some interesting insight into how to prepare visualization images for the engineering literature. Here is the textual part of the entry, the visualization support part of the entry and the academic paper, to which it relates.
Last updated by Joanna Leng on the 24th of August 2011.