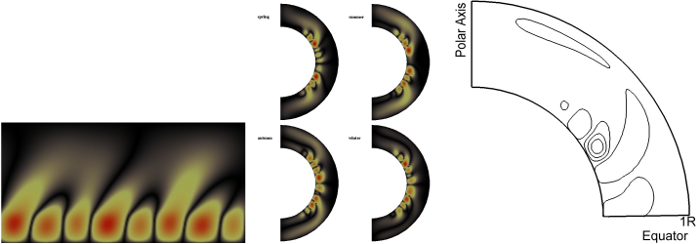

Visualizations are used in many different disciplines, each with their own research practices that are accepted by peer review; some research areas have a number of sub-groups with a variety of practices. Each group typically has distinct ways of presenting and visualizing their results. Some solar physicists are interested in simulating the electro-magnetic (magnetohydrodynamic) activity of the outer layer of the Sun. The gaseous interior of the Sun has complex electro-magnetic behaviour that causes an induction feedback system within the simulation which is very complex to model mathematically. To simplify the physics typically a box dynamo model is used. This creates a series of 2D orthogonal slices which evolve over time to display a cycle of activity. However the Sun is a curved surface and the orthogonal results of the box dynamo can be translated and presented in a geometrically accurate shape. Figure 2 shows a variety of ways that the same results from a box dynamo simulation can be presented; each style of presentation is preferred by different sub-groups of solar physicists.
This shows visualizations of a box dynamo presented in various ways that are commonly used in the solar physics literature. The image on the left shows a cross section, close to but not on the equator, of all the time slices making up 2 solar cycles presented in the orthogonal geometry in which it is simulated. The image in the middle shows 4 time slices of one solar cycle presented in a realistic curvilinear geometry. The image on the right shows one image data set from the middle image but here only half the time slice is shown and it is rendered in isolines.
Last updated by Joanna Leng on the 14th of August 2011.