
This work was done as a portotype project with the Microbial Risk Assessment group which is a department within the Health Protection Agency (HPA) in the UK. We recently completed a chapter on this work:
Contingency planning in the HPA has been achieved through epidemiological studies and the use of computational models. The computational models take some time to execute and ran through batch queue systems. The results tend to be analysed numerically, there was a complex post processing procedure that was used to produce visualizations of the results but this was rarely done.
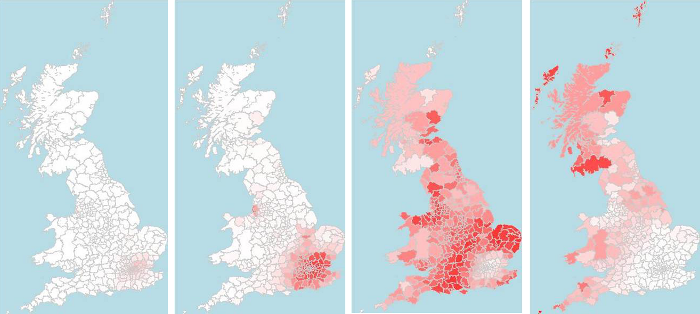
Shows the spread of infectious disease. The simulation is time dependant nature so the results are shown as a series of time steps but there are too many time steps so only a small number can be viewed at any time. In this case it is spreading out of London.
Adapting the simulation so that it could be executed on a large parallel system and interactively altered is a technique called computational steering. Computational steering refers to making large scale simulations interactive and takes advantage of a paradigm of high performance computing termed distributed computing. The computer that runs the simulation is separate from the one that produces the visualization which is separate from the one that is used to control and view the simulation.
Making one of these computational epidemiological models interactive was complicated as the codes needed considerable re-engineered. The re-engineering was integrated into the normal development cycle of the codes so it took about a year for them to be ready for computational steering.
The Reality Grid libraries were used to make the computational steering possible. When this was integrated into the codes the simulation could be steered and some simple graphs could be observed, however this did not give the user all the information that they wanted. Instead an interactive visualization front end was developed that could communicate with the simulation through the Reality Grid libraries.
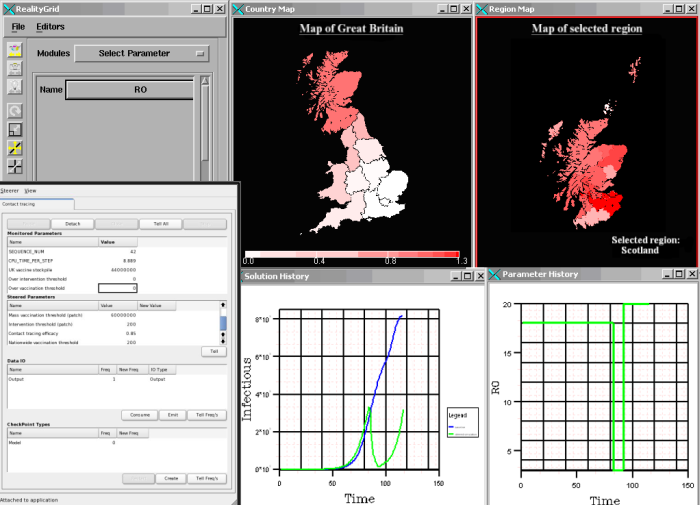
Screen shot of the visualization and steering interface. This was a prototype projects so a variety of windows were used rather than developing a single interface. Windows clockwise from top left: a) the AVS/Express control panel showing that the R0 steerable parameter is selected to have its history displayed; b) map detailing (in pseudo-colour) the disease activity in the regions of Great Britain; c) a similar map for the counties for the (user-selected) region of Scotland; d) a graph showing the history of R0 changed at two time points; e) the national-level history of the proportion of infectious cases in the population with (blue line) the baseline case (R0 constant) and (green line) the steered case; inset) the QT Steerer panel.
The visualization front end consisted of graphs, commonly used in computational epidemiology, and interactive maps. The maps showed the political boundaries used within the model and displayed each time step of the simulation. Geographic detail could be explored as the system used a technique called 'drill down'. This technique allows the user to click on the map of the UK and a more detailed version of that region becomes visible. The simulation allows for 4 levels of detail to be drilled into; however the size of the screen make it difficult at this time for all levels to be used for drill down.
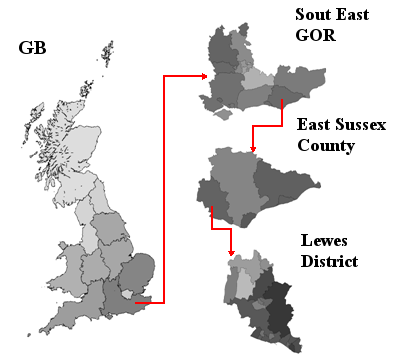
A demonstration of ’drilling down’, showing four levels of detail from the GOR-level of Great Britain through to the electoral wards making up the Lewes district. User interaction controls the drilling down process — arrows have been added to show which areas have been selected by the user. Reported (and represented as tones of grey) is the per-capita rate of incidence of new cases of disease at one time point in a simulation. Over time there is a large variation in this rate of incidence so selection of appropriate grey scales must be made with care. This is an exemplar image created specifically for this work.
Meetings with the stakeholders indicate that this approach is potentially game changing. Computational steering and interactive visualization both offer very different opportunities; it is the interactive visualization that has the most potential.
Last updated by Joanna Leng on the 23rd of August 2011.